Let’s process EDA for Telangana’s Industrial setup. This documentation is a breif overview of the entire dataset exploration and will focus only on the important findings.
Table of Contents
Pre-requisites to this Guide:
- Install Pandas
- Install Plotly, Dash, Jupyter-Dash
In this article, we will perform Exploratory Data Analysis on the Telaganana IPASS Dataset. We will clean, prune and visualize the dataset looking at various features of pandas.
Data Extraction & Cleaning:
We add the directory to the ‘path’ and read all the csv files and merge them under a single file ‘all_time_data’.
def main():
    path = "./Telangana_Industries_TS_IPass"
    files = [file for file in os.listdir(path) if not file.startswith('.')] # Ignore hidden files
    all_time_data = pd.DataFrame()
    for file in files:
        current_data = pd.read_csv(path+"/"+file)
        all_time_data = pd.concat([all_time_data, current_data])
    all_time_data.to_csv("all_time_data_copy.csv", index=False)
    return all_time_data
if __name__ == "__main__":
    all_time_data = main()
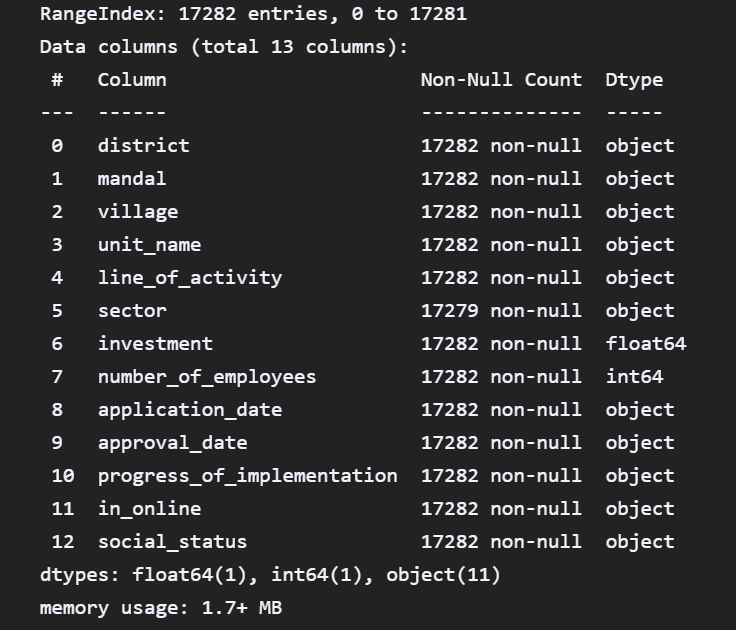
‘all_time_data’ has 17282 rows and 18 columns.
all_time_data.shape
all_time_data.info()
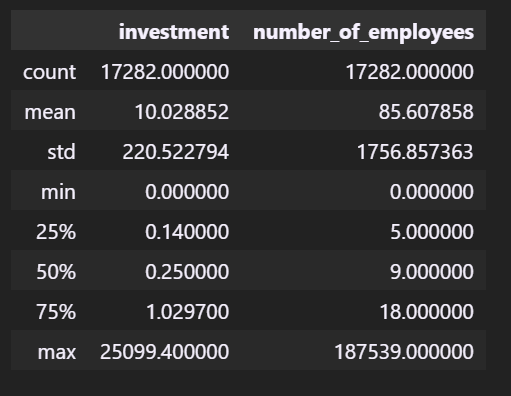
all_time_data.describe( )
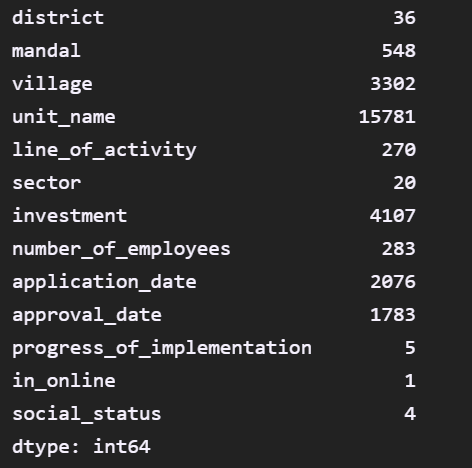
all_time_data.nunique()
We need to understand various investments, employees per year so we take the application date and rank these values by application dates.
all_time_data['application_date'] = pd.to_datetime(all_time_data['application_date'])
all_time_data['approval_date'] = pd.to_datetime(all_time_data['approval_date'])
all_time_data.sort_values(by='application_date', inplace=True)
all_time_data['Year'] = pd.to_datetime(all_time_data['application_date']).dt.year
Data Insights:
We need to answer the following questions:
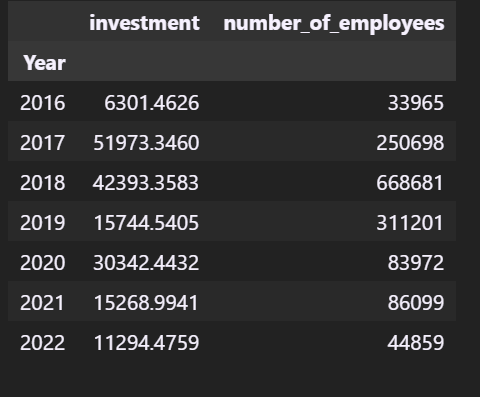
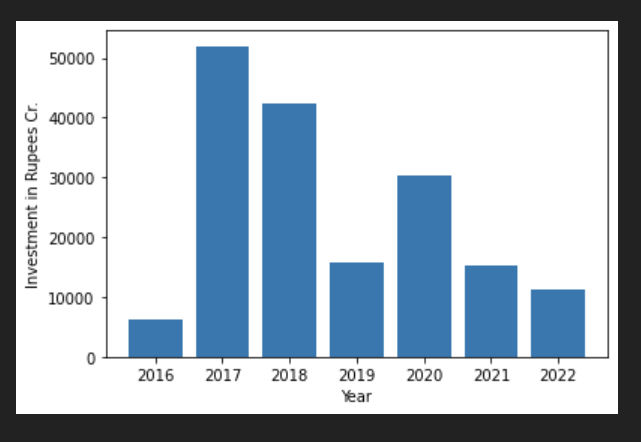
- Sum of all employees, investment year wise ?
Answer: We group the data by year and then map the sum of the ivestment annually.
all_time_data.groupby(['Year']).sum()
years = range(2016,2023)
plt.bar(years,all_time_data.groupby(['Year']).sum()['investment'])
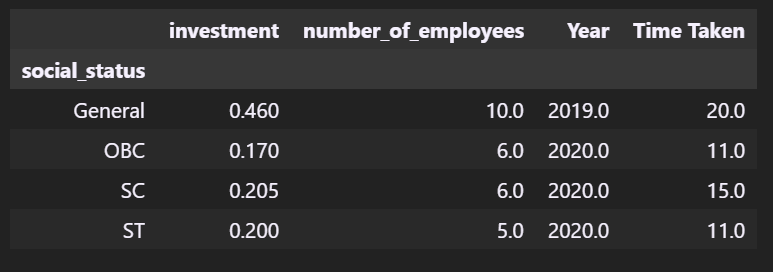
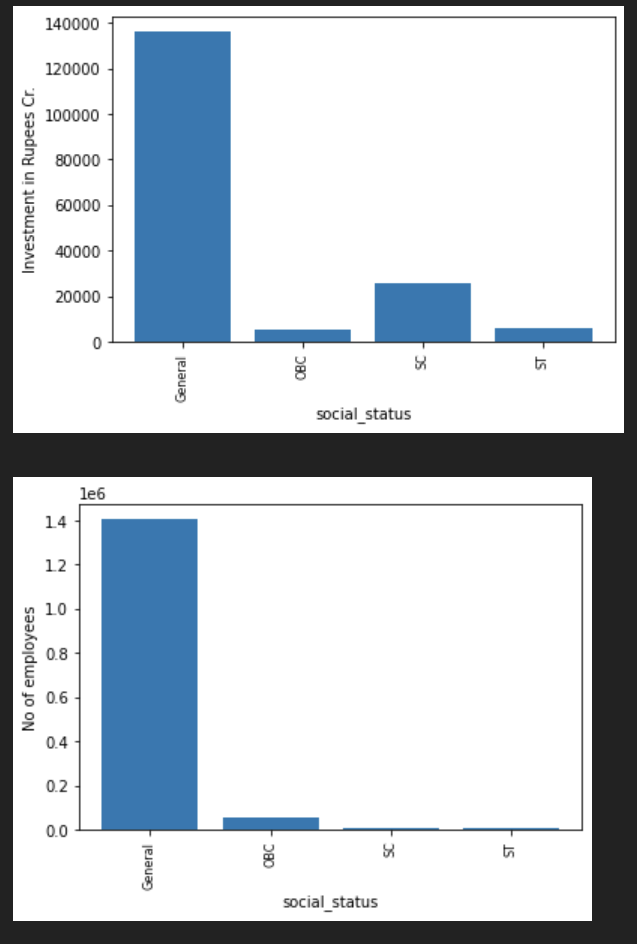
- What was the social status demogrpahics of investments in Telangana?
Answer:
all_time_data.groupby(['social_status']).median()
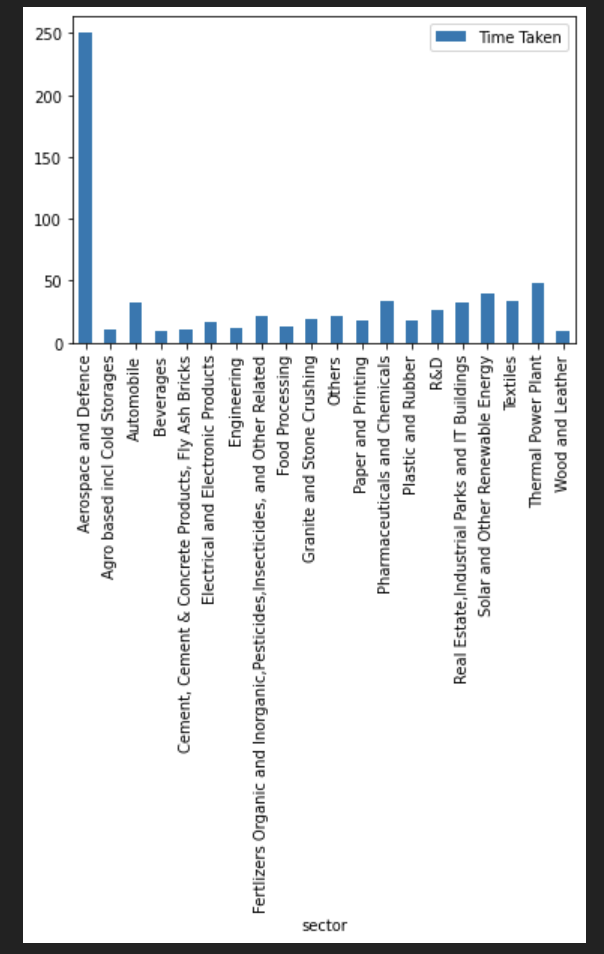
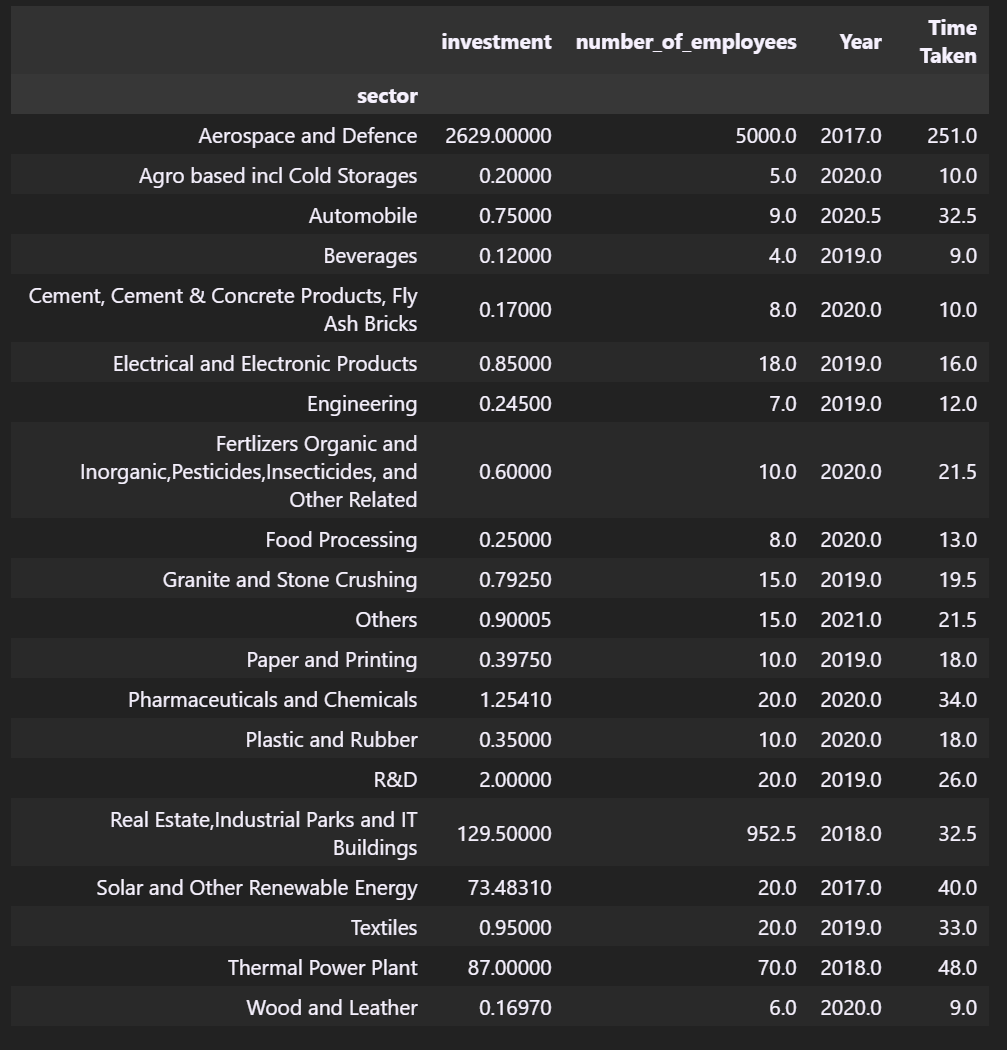
- What was the average time taken for approval industry wise in Telangana?
all_time_data['Time Taken'] = all_time_data['approval_date']-all_time_data['application_date']
all_time_data['Time Taken'] = all_time_data['Time Taken'].dt.days.astype('int64')
Time_taken_genuine = all_time_data[all_time_data['Time Taken']>0]
time_taken_for_sector_approval = all_time_data[["sector","application_date", "Time Taken","progress_of_implementation"]]
time_taken_for_sector_approval.groupby(['sector']).median().plot.bar()
all_time_data.groupby(['sector']).median()
- What was the average investment, employees, Approval time for districts wise analysis?
all_time_data.groupby(['district']).median().sort_values(by=['investment'])
Note: Data present in the table is not the full representation of every district.
We also map the sum of all the investments in every sector and we achieve this graph.
sector_keys = [status for status, all_time_data in all_time_data.groupby(['sector'])]
plt.bar(sector_keys,all_time_data.groupby(['sector']).sum()['investment'])
plt.ylabel('Investment in Rupees Cr.')
plt.xlabel('social_status')
plt.xticks(sector_keys, rotation='vertical', size=8)
plt.show()
